You can use the Performance Analytics to report on historic performance and also analyse future business on the books.
Performance landing page Structure
Key Performance Indicators (KPIs)
When you open the Performance page, five Key Performance Indicators (KPIs) are displayed with numbers and charts:
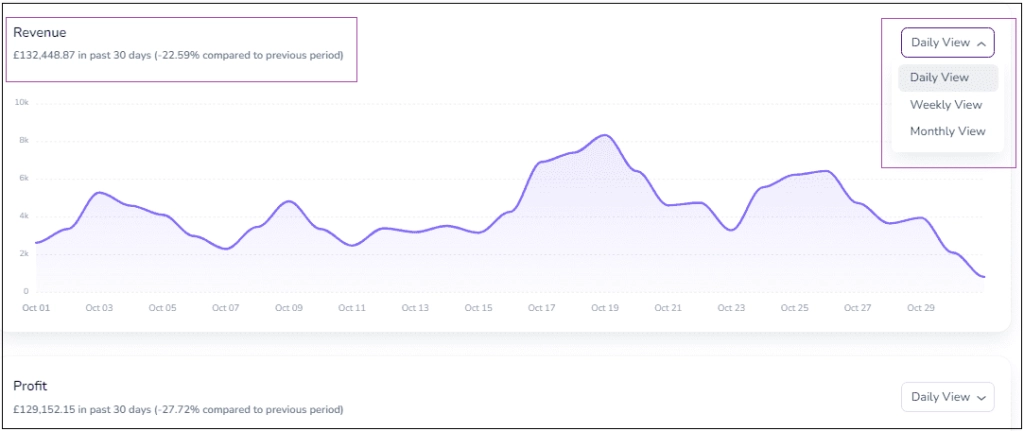
Revenue (The Total Channel Sales minus Taxes)
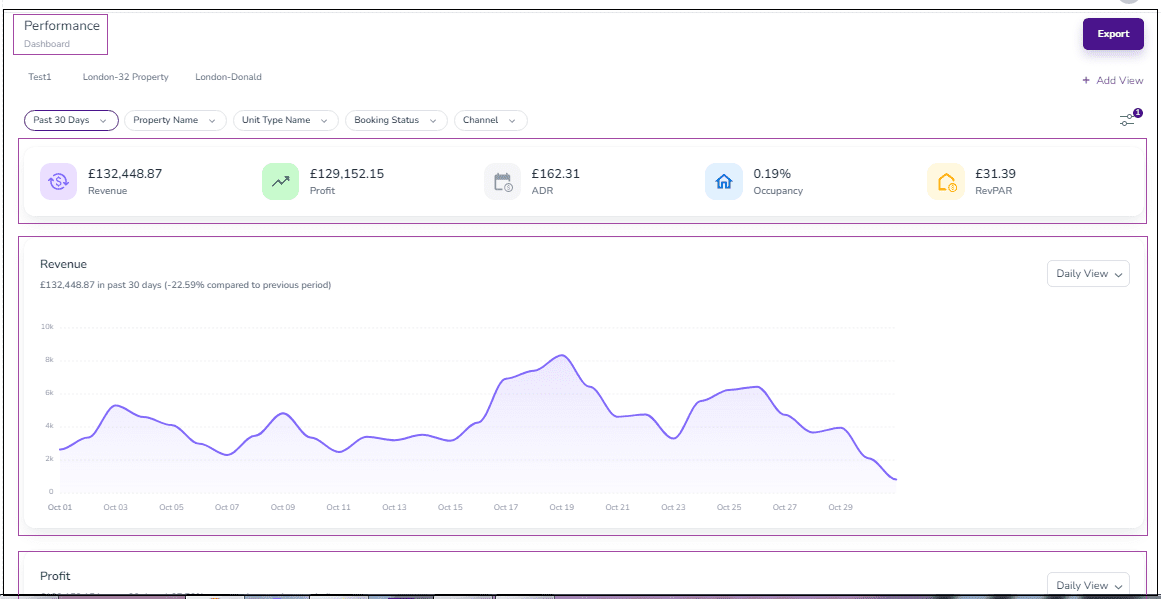
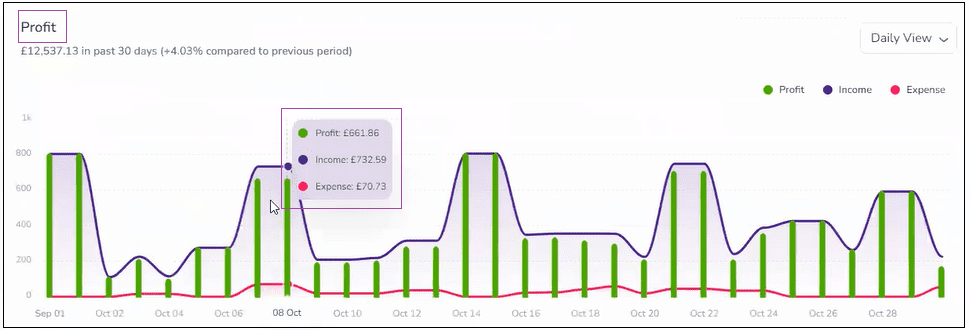
Profit (The difference between Income and Expense)
ADR (The Division of Revenue by Occupied Units)
Occupancy (The Division of Occupied Units by Available Units)
RevPAR (The Division of Revenue by Available Units)
Note 1: Each KPI has its own chart, and you can check the data according to your Applied Filters. The charts offer three different views based on the Time Frame of your choice (Daily, Weekly, and Monthly).
Note 2: The total amount shown under the title of the chart is the total amount in that date range you specify and it is compared in percentage with the previous period.
Applied Filters
You can view the KPIs using five or click on Filter icon to add more filters:

There is a Default Filter when you visit the page at the first stage with the
Date Range set to Past 30 Days and the Booking Status set to All Statuses except Cancelled Bookings.
Each of these five Default Filters has a drop-down menu for selecting your desired filter. For the Date Range filter, you can either select your time or tick Custom option to choose the Start and End dates.
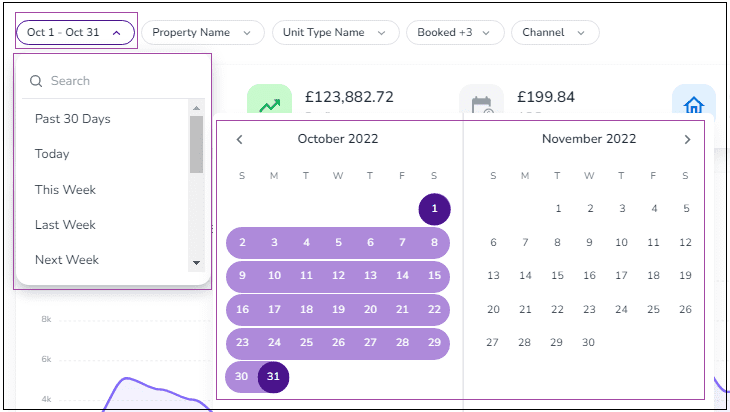
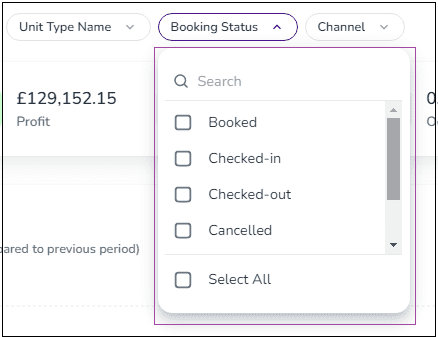
For Property Name, Unit Type Name, or Channel, you can select your desired name(s) or Select All, and finally, tick your desired status for Booking Status.
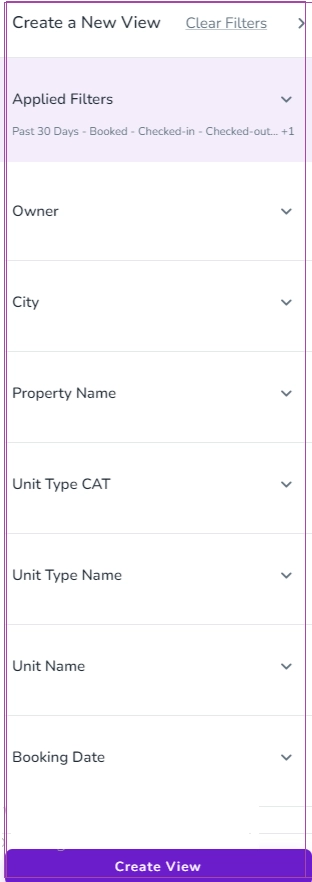
When you click on the Filter icon, a window will appear where you can use the following filters to further specify the results shown on your Performance page:
City
Unit Type CAT (You can select the category of Unit Type)
Booking Date
Arrival Date
Departure Date
Length Of Stay
Payment Status
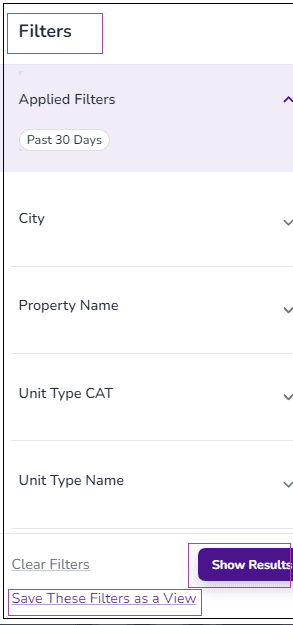
After specifying your desired Filter(s), click on Show Results to view the performance.
Note 1: You can click on Clear Filters to start afresh or start again or start from scratch.
Note 2: If you’d like to have any of these Filters be shown as a fixed view on your Performance page, you can click on Save These Filters as a View. Then, a window pops up in which you can pick a name for your View and click on Create.
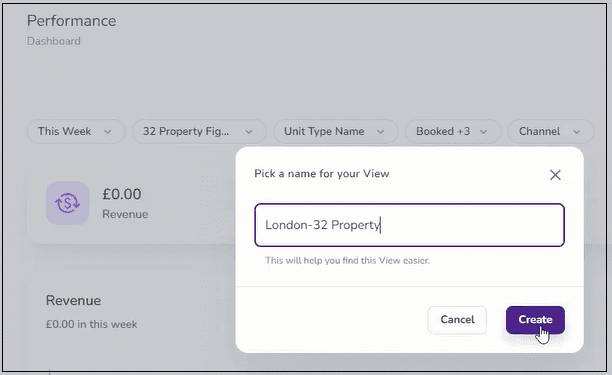
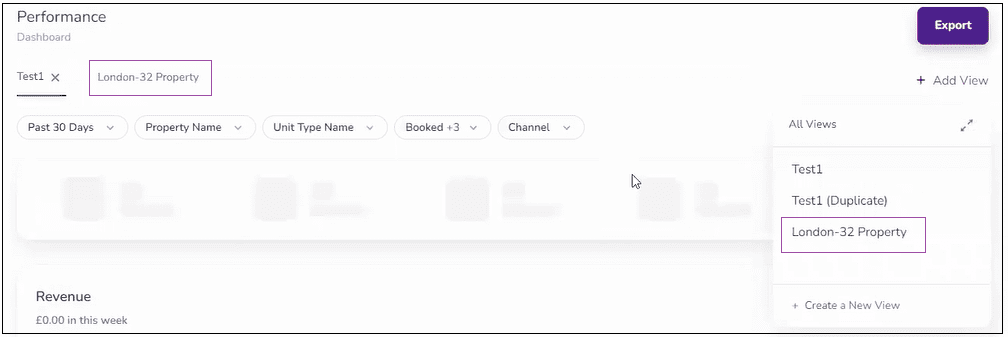
The created View will be displayed as a tab on your Performance page and under the All Views drop-down.
All Views
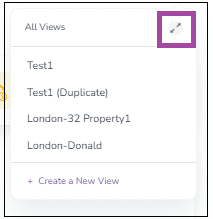
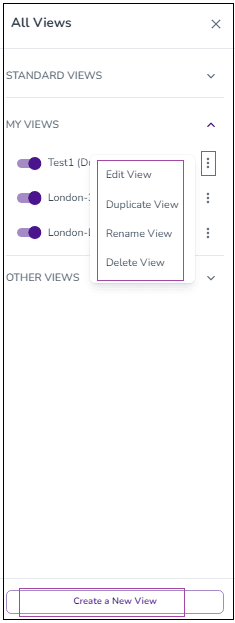
By clicking on + Add View, a window pops up in which you can see the list of All Views. If you click on the arrows in front of it, a window pops up in which you can click on the three dots in front of the created Views to Edit, Duplicate, Rename or Delete. As only five Views can be shown at the top of the Performance page, you should toggle on the ones you want to be displayed.
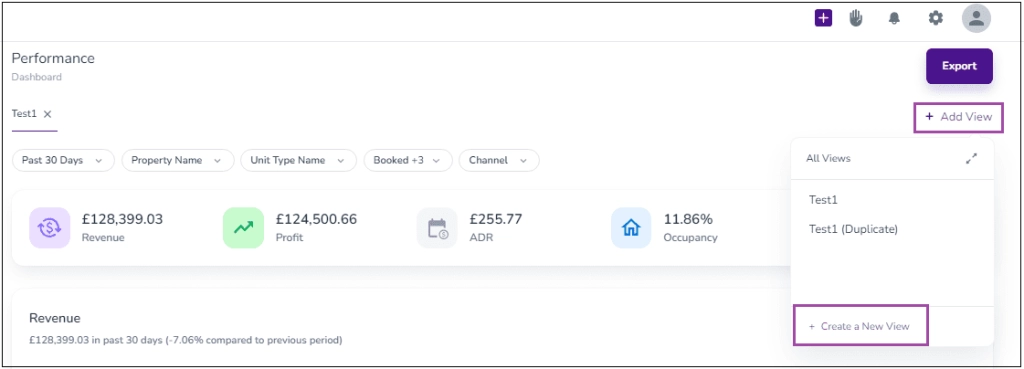
Alternatively, you can click on + Create a New View (the process is the same as above).
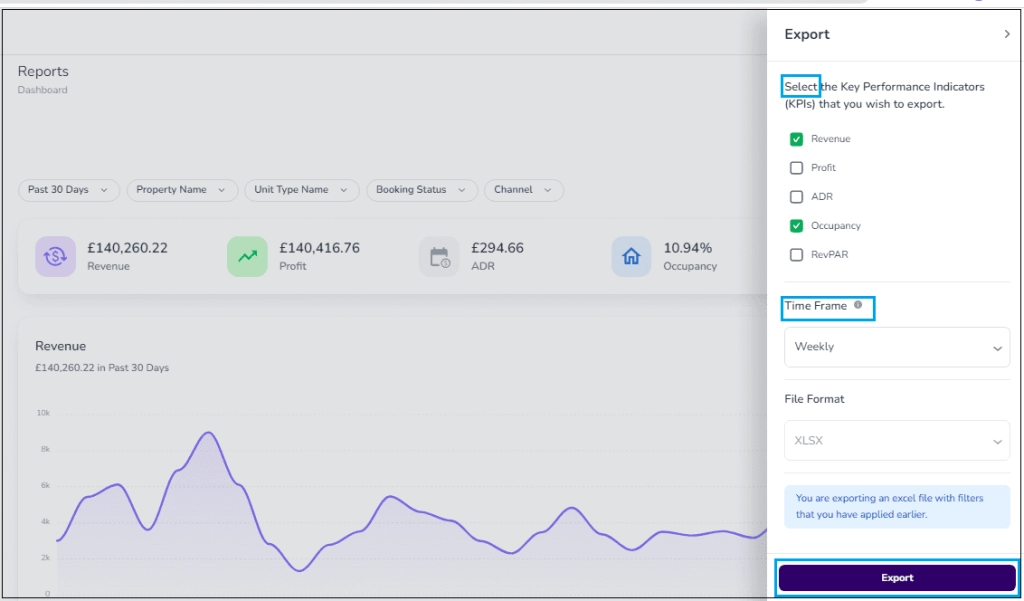
Export
You can make an Excel sheet report by clicking on Export on the right top of the Performance page. Then, a window opens in which you can select the Key Performance Indicators (KPIs) that you wish to export. You should also select the Time Frame (Daily, Weekly, Monthly) from the drop-down. Finally, click on Export.

